Press Release
Sprott Resource Holdings Inc. Announces Positive Results from Technical Studies on the Minera Tres Valles Copper Project
Project Expected to Generate Significant Cash Flow in 2020 High Project Internal Rate of Return with Less than 2 Year Payback
TORONTO, Nov. 02, 2018 (GLOBE NEWSWIRE) -- Sprott Resource Holdings Inc. (“SRHI” or the “Company”) (TSX:SRHI) is pleased to announce the results from a series of technical studies (the “Technical Studies”) on its 70% owned Minera Tres Valles Copper Project (“MTV” or the “Project”) located in Salamanca in Region IV of Chile which will be reported in a consolidated NI 43-101 compliant technical report (the “Technical Report”). The Technical Studies were completed by Amec Foster Wheeler, a Wood company (“Wood”) along with contributions from independent consulting firms.
“We are very pleased with the results of the Technical Studies which validates our initial due diligence and investment thesis for the Project,” said Steve Yuzpe, CEO of SRHI. “The Technical Studies confirm that MTV should almost triple current levels of production achieving a run rate of approximately 18,000 tonnes per annum of copper cathodes,” added Mr. Yuzpe. “Based on a long-term copper price of US$2.75/lb, the preliminary economic assessment which looked at the total available mineral resources on the Project indicates that MTV could generate US$34 million in project cash flow in 2020 peaking at US$45 million in 2022.”
“The mine is operating well and crushing more than 100,000 tonnes of mineralized material per month,” said Luis Vega, CEO of MTV. “With the substantial infrastructure and development built by Vale S.A., the capital cost required to ramp up to full production is low and has resulted in attractive project economics with a short payback period.”
“We continue to believe in the long-term fundamentals for copper and Chile as a premier mining jurisdiction,” said Rick Rule, CIO of SRHI. “MTV is a core asset for SRHI and we are focused on building from this foundation.”
Table 1. Technical Studies – Economic Analysis Highlights (US dollars)
| Base Case | PEA Case | |
| Pre-tax Net Present Value (NPV) (8%) | $87M | $129M |
| After-tax Net Present Value (NPV) (8%) | $87M | $129M |
| Pre-tax Internal Rate of Return (IRR) | 93% | 131% |
| After-tax Internal Rate of Return (IRR) | 93% | 131% |
| Payback (years) | 2.0 | 1.2 |
| Average Annual Copper Cathode Production (2019-2025) | 24M lbs | 34M lbs |
| Total Copper Cathode Production (LOM) | 177M lbs | 250M lbs |
| 2020 Cash Flow | $23M | $34M |
| Life of Mine | 6.5 years | 7.5 years |
| Operating Cash Cost (per lb of finished copper) | $1.66/lb | $1.65/lb |
| Upfront Capital Cost | $15M | $21M |
| LOM Capital Cost | $32M | $52M |
Notes:
- Base Case includes only the Don Gabriel Manto open pit, Papomono Masivo underground and ENAMI tolling revenues. The PEA Case includes the Don Gabriel Manto, Papomono Masivo, Don Gabriel Vetas, Papomono Norte, Manto Norte, Epitermal, Papomono Cumbre, Papomono Mantos Conexión and Papomono Sur. The PEA Case also includes ENAMI tolling revenues.
- The PEA Case is preliminary in nature and includes inferred resources that are too speculative geologically to have the economic considerations applied to them. There is no certainty the PEA Case will be realized.
- Base Case capital cost estimate was completed at a cost accuracy of +/- 25%. PEA Case capital cost estimate was completed at a cost accuracy of +/- 50%.
- Based on long-term flat copper price forecast of US$2.75/lb.
- Includes revenue from long-term tolling contract with ENAMI of minimum of 15,000 t/month and a tolling rate of US$27.50/t of material received. MTV delivers copper cathodes produced from supplied feed material to ENAMI, on the basis of a contractual metallurgical recovery of 78%.
- MTV has tax losses available to apply that will shelter any tax payable on operating profits, due to capital costs and operating losses sustained by prior operators. MTV is subject to a sliding scale copper royalty payable to the Chilean government.
- Does not include copper production from purchasing of mineralized material from small scale third party miners and any additional copper production pursuant to excess recovery from the ENAMI toll milled material.
- NPV is calculated based on monthly discounting using a reference date of July 2018.
Highlights of the Technical Studies include:
- Low Capital Cost to Triple Production with Short Payback Period
- Low project capital requirement of US$15 million for the base case mine plan (the “Base Case”) and US$21 million for the PEA (the “PEA Case”) to ramp-up operation to approximately 18,0001 tonnes per annum of copper cathodes within 24 months
- Low capital intensity
- Short payback of 2.0 years for the Base Case and 1.2 years for the PEA Case
- Positive project economics demonstrated by economic analysis confirms SRHI’s investment thesis2
- Base Case pre-tax and after-tax NPV (8%) of US$87 million and IRR of 93% based on a long-term flat copper price of US$2.75/lb
- PEA Case pre-tax and after-tax NPV (8%) of US$129 million and IRR of 131% based on a long-term flat copper price of US$2.75/lb
- Average annual copper cathode production estimates (2019-2025) of 24 million pounds per annum for the Base Case and 34 million pounds per annum for the PEA Case
- 6.5 year mine life (“LOM”) for the Base Case and 7.5 year LOM for the PEA Case with opportunity to extend through exploration on 44,000 hectares of land
- Attractive LOM operating cash costs estimate of US$1.66/lb of finished copper for the Base Case and US$1.65/lb of finished copper for the PEA Case
- Base Case demonstrates potential to generate cash flow of US$23 million in 2020 with peak cash flow reaching US$45 million in 2022
- PEA Case demonstrates potential to generate cash flow of US$34 million in 2020 with peak cash flow reaching US$45 million in 2022
- Completion of Technical Studies and related Technical Report is key to advancing currently ongoing project financing discussions
Technical Studies
The purpose of the Technical Report is to consolidate all the NI 43-101 compliant Technical Studies completed over the past 10 months, including:
- Mineral resource and mineral reserve estimates for the Don Gabriel and Papomono deposits;
- Preliminary Feasibility Study (“PFS”) for the implementation of chloride leaching (“Salt Leach”);
- Feasibility Study (“FS”) for the expansion of the Don Gabriel Manto open pit;
- PFS for the underground exploitation of the Papomono Masivo mine zone; and,
- Preliminary Economic Assessment (“PEA”) on a subset of MTV's mineral resources.
The Technical Studies comprise a Base Case based on the exploitable mineral reserves from the Don Gabriel Manto open pit and the Papomono Masivo incline block cave underground deposit. These studies were completed at a FS level for Don Gabriel Manto and a PFS level for Papomono Masivo and the Salt Leach conversion. Wood has also completed a PEA Case for the exploitation of the Don Gabriel Manto and Papomono Masivo deposits and eight additional mining zones within the Don Gabriel and Papomono deposits which will utilize different mining methods such as sub-level caving and sub-level stopping. These additional eight mining zones will require additional drilling and engineering work to increase the confidence level. The PEA Case illustrates the property-wide production potential for the Project.
The PEA Case mine plan is partly based on inferred mineral resources that are considered too speculative geologically to have the economic considerations applied to them that would enable them to be categorized as mineral reserves, and there is no certainty that the PEA Case based on these mineral resources will be realized. Mineral resources that are not mineral reserves do not have demonstrated economic viability. The Technical Report will be filed within 45 days of this release.
ENAMI and Third Party Material Treatment
As part of MTV’s toll processing strategy, MTV purchases mineralized material from third-party miners that operate near and on the MTV property and toll treat mineralized material from Empresa Nacional de Minería (“ENAMI”), the Chilean state owned enterprise that supports small and artisanal miners under the provisions of a long-term contract (the “ENAMI Tolling Contract”). This strategy is expected to continue going forward. Since 2014, MTV has purchased an average of 14,500 tonnes per month of mineralized material with a copper grade of 1.44%. Since SRHI’s acquisition in October 2017, MTV has purchased an average of 16,500 tonnes per month at a grade of 1.13% copper. Since 2014, ENAMI has delivered an average of 8,000 tonnes per month of mineralized material with a copper grade of 2.30%. Since SRHI’s acquisition in October 2017, ENAMI has delivered an average of 4,300 tonnes per month of copper at the same grade. The mineralized material from ENAMI and the small scale third-party miners has not been subject to any technical study, and is therefore not included in the Base Case and PEA Case mine plan and economic analysis contained in the Technical Studies, apart from the toll treatment revenue which serves to reduce the processing and general and administrative (“G&A”) unit cost. The economic analysis described in this press release also includes operating costs for the toll treatment.
In 2017, MTV produced 11.3 million pounds of copper cathode which comprised 8.6 million pounds from MTV’s own Project and 2.7 million pounds from small scale third party miners and the excess recovery of mineralized material delivered under the ENAMI tolling arrangements.
Next Steps
- With the results of the Technical Studies and of the Technical Report, SRHI will be working with MTV to secure the necessary expansion capital. Several parties have submitted term sheets, and the Technical Report is expected to assist in the technical diligence to secure the best terms for financing.
- MTV has already commenced the Don Gabriel open pit expansion, and the mining contractor, Vecchiola S.A., and the haulage contractor, Tiex, have brought substantially all of the heavy equipment for the pre-strip and ore movement on site.
- MTV have also firmed up quotations for the long-lead time equipment required for the salt-leach project.
- With the work completed by Wood on the Papomono Masivo, MTV will advance to detailed engineering based on the PFS study, and have quotations for the required underground equipment in the near-term.
- MTV will commence an infill drill campaign on the PEA Case additional deposits to increase the confidence level of the mineral resources, determine and define any additional mineral resources, and also advance geotechnical work on these deposits adjacent to the current operations.
Consolidated Mine Plan
Figure 1 illustrates the Base Case mine plan using mineral reserves from the Papomono and Don Gabriel deposits.
Figure 1. Base Case Forecast Mine and Process Plan
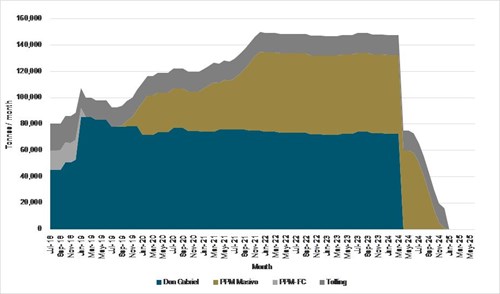
Notes: Figure prepared by Wood, 2018. Don Gabriel Manto open pit is the main mine zone from Don Gabriel deposit. Papomono Masivo IBC and Papomono Masivo FC are the zones that will be mined from the Papomono deposit. Dark grey shading indicates additional processing capacity for material anticipated to be delivered under the ENAMI Tolling Contract that could be toll treated. Dark grey shading indicates additional processing capacity for material anticipated to be delivered under the ENAMI Tolling Contract that could be toll-treated.
Figure 2 illustrates the property-wide mine plan based on the PEA Case.
Figure 2. PEA Case Forecast Mine Production Plan
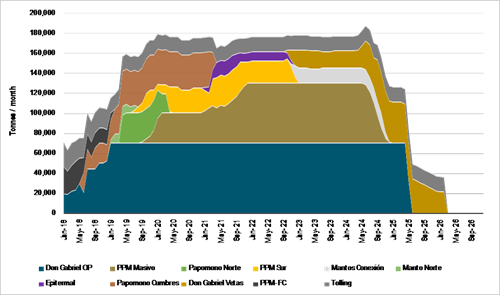
Notes: Figure prepared by Wood, 2018. The PEA Case is preliminary in nature and includes inferred mineral resources that are too speculative geologically to have the economic considerations applied to them. There is no certainty that the PEA Case will be realized. Dark grey shading indicates additional processing capacity for material anticipated to be delivered under the ENAMI Tolling Contract that could be toll-treated.
Table 2 and 3 below summarizes the cash flow analysis for the Base Case and PEA Case. The Technical Studies economic evaluation considers cash flows starting in July 2018 (month one). This is consistent with the use of fiscal years (July to June).
Table 2. Economic Results for Base Case
| Cathode | Total | Mine | Plant / G&A | Opex | Pre-tax | After-tax | |||
| Production | Cu | Capex | Opex | Opex | Total | Revenue | Cash Flow | Cash Flow | |
| Year | (kt) | (t) | (US$ 000s) | (US$ 000s) | (US$ 000s) | (US$ 000s) | (US$ 000s) | (US$ 000s) | (US$ 000s) |
| 2018 | 502 | 4,291 | 7,312 | 8,639 | 13,381 | 22,020 | 22,097 | -7,236 | -7,236 |
| 2019 | 1,185 | 7,932 | 7,968 | 19,600 | 27,777 | 47,377 | 42,022 | -13,322 | -13,322 |
| 2020 | 1,426 | 13,418 | 2,320 | 20,844 | 30,482 | 51,326 | 76,169 | 22,522 | 22,510 |
| 2021 | 1,593 | 13,224 | 4,464 | 17,876 | 31,288 | 49,164 | 74,983 | 21,355 | 21,342 |
| 2022 | 1,781 | 16,585 | 1,312 | 15,742 | 33,155 | 48,897 | 95,582 | 45,373 | 45,289 |
| 2023 | 1,775 | 15,407 | 497 | 12,432 | 32,807 | 45,239 | 88,358 | 42,622 | 42,564 |
| 2024 | 894 | 8,958 | 512 | 6,733 | 20,302 | 27,035 | 48,836 | 21,289 | 21,289 |
| 2025 | 0 | 301 | 7,522 | 204 | 1,845 | 2,048 | 379 | -9,192 | -9,192 |
| 2026 | 0 | 0 | 0 | 0 | 0 | 0 | 0 | 0 | 0 |
| Total | 9,156 | 80,116 | 31,907 | 102,070 | 191,036 | 293,106 | 448,425 | 123,412 | 123,244 |
Notes:
- Assumes a long-term flat copper price of US$2.75/lb
- Analysis assumes cash flows starting in July 2018. Results were obtained on the bases of a monthly mine plan and cash flows discounted on the same monthly basis.
- Processing recovery is based on the salt leach process, for all years, except for 2018. Assumptions for 2018 are based on acid leaching without salt.
- Revenues and operating costs for the ENAMI toll treatment is based on a minimum of 15,000 t/month of feed material and a tolling rate of US$27.50/t of material received. MTV delivers copper cathodes produced from supplied feed material to ENAMI, on the basis of a contractual metallurgical recovery of 78% based on the oxide grade as per the terms of the ENAMI Tolling Contract. Revenue from excess recovery is not included in this analysis.
- MTV has tax losses available to apply that will shelter any tax payable on operating profits, due to capital costs and operating losses sustained by prior operators. MTV is subject to a sliding scale copper royalty payable to the Chilean government.
Table 3. Economic Results for PEA Case
| Cathode | Total | Mine | Plant | G&A | Opex | Pre-tax | After-tax | |||
| Production | Cu | Capex | Opex | Opex | Opex | Total | Revenue | Cash Flow | Cash Flow | |
| Year | (kt) | (t) | (US$ 000s) | (US$ 000s) | (US$ 000s) | (US$ 000s) | (US$ 000s) | (US$ 000s) | (US$ 000s) | (US$ 000s) |
| 2018 | 612 | 4,709 | 8,628 | 10,613 | 9,456 | 4,613 | 24,682 | 24,661 | -8,649 | -8,649 |
| 2019 | 1,831 | 12,235 | 13,362 | 30,053 | 23,075 | 9,226 | 62,354 | 68,395 | -7,321 | -7,321 |
| 2020 | 2,119 | 17,684 | 6,483 | 26,198 | 25,984 | 9,226 | 61,408 | 102,316 | 34,425 | 34,344 |
| 2021 | 2,079 | 17,406 | 4,950 | 24,145 | 25,668 | 9,226 | 59,040 | 100,615 | 36,626 | 36,542 |
| 2022 | 2,129 | 18,477 | 4,300 | 22,408 | 26,205 | 9,226 | 57,840 | 107,178 | 45,038 | 44,919 |
| 2023 | 2,136 | 16,501 | 2,002 | 19,301 | 25,711 | 9,226 | 54,239 | 95,065 | 38,824 | 38,755 |
| 2024 | 2,032 | 16,819 | 2,619 | 21,488 | 25,264 | 9,226 | 55,978 | 97,014 | 38,416 | 38,342 |
| 2025 | 897 | 8,239 | 2,664 | 10,128 | 13,816 | 6,882 | 30,827 | 44,519 | 11,028 | 11,028 |
| 2026 | 74 | 1,176 | 7,266 | 887 | 1,915 | 2,114 | 4,916 | 4,860 | -7,322 | -7,322 |
| Total | 13,909 | 113,246 | 52,273 | 165,222 | 177,094 | 68,968 | 411,284 | 644,623 | 181,067 | 180,638 |
Notes:
- The PEA Case is preliminary in nature and includes inferred resources that are too speculative geologically to have the economic considerations applied to them. There is no certainty that the PEA Case will be realized.
- Assumes a long-term flat copper price of US$2.75/lb
- Analysis assumes cash flows starting in July 2018. Results were obtained on the bases of a monthly mine plan and cash flows discounted on the same monthly basis.
- Processing recovery is based on the salt leach process, for all years, except for 2018. Assumptions for 2018 are based on acid leaching without salt.
- Revenues and operating costs for the ENAMI toll treatment is based on a minimum of 15,000 t/month of feed material and a tolling rate of US$27.50/t of material received. MTV delivers copper cathodes produced from supplied feed material to ENAMI, on the basis of a contractual metallurgical recovery of 78% based on the oxide grade as per the terms of the ENAMI Tolling Contract. Revenue from excess recovery is not included in this analysis.
- MTV has tax losses available to apply that will shelter any tax payable on operating profits, due to capital costs and operating losses sustained by prior operators. MTV is subject to a sliding scale copper royalty payable to the Chilean government.
Capital Costs
The total initial capital cost for the PEA Case is estimated to be approximately US$21 million. The total capital cost for the project over the entire life of mine is US$52 million.
A breakdown of the PEA Case capital costs estimate is provided below:
Table 4. Capex Estimates for PEA Case (US$ 000s)
| Sustaining / | ||||
| Upfront | Development | Total | Expected | |
| Capital | Capital | Capital | Year of | |
| Category | Costs | Costs | Costs | Expenditure |
| Salt Leach Implementation | 7,000 | 0 | 7,000 | 2018 - 2019 |
| Don Gabriel Manto | 0 | 0 | 0 | 2018 - 2019 |
| Papomono Masivo | 7,783 | 6,665 | 14,448 | 2018 - 2022 |
| Additional Eight Mining Zones | 4,622 | 11,772 | 16,394 | 2018 - 2026 |
| Infill Drilling Campaign | 2,088 | 1,884 | 3,972 | 2018 - 2021 |
| Plant Sustaining Capex | 0 | 3,494 | 3,494 | 2019 - 2025 |
| Closure Costs | 0 | 6,965 | 6,965 | 2026 |
| Total Capital | 21,493 | 30,780 | 52,273 |
Notes:
- Don Gabriel capital costs are associated with pre-stripping which has been included in operating cash costs.
- Additional Eight Mining Zones includes the mining zones within the Don Gabriel and Papomono deposits which include: Don Gabriel Vetas, Papomono Norte, Manto Norte, Epitermal, Papomono Cumbre, Papomono Mantos Conexión and Papomono Sur.
- The PEA Case is preliminary in nature and includes inferred mineral resources that are too speculative geologically to have the economic considerations applied to them. There is no certainty that the PEA Case will be realized PEA Case capital costs completed at an accuracy of +/- 50%.
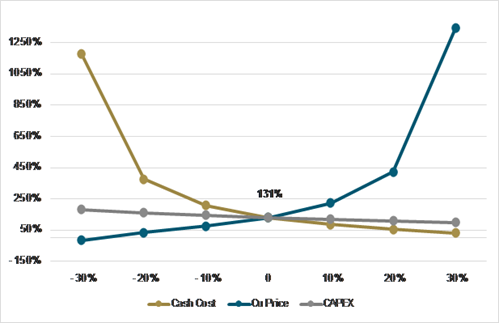
Sensitivity Analysis3
A sensitivity analysis on varying cash costs, copper price and capex was completed on the pre-tax and after-tax NPV (8%) and IRR. Results are summarized below.
Figure 3. Sensitivity Analysis (Base Case Pre-tax NPV; US$ millions)
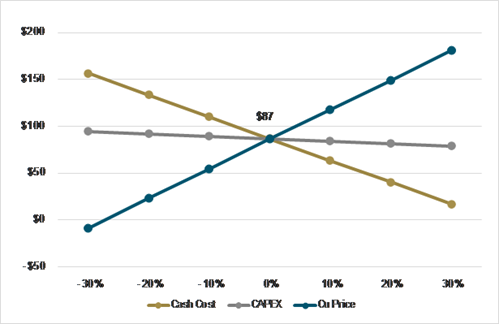
Figure 4. Sensitivity Analysis (PEA Mine Plan Pre-Tax NPV; US$ millions)
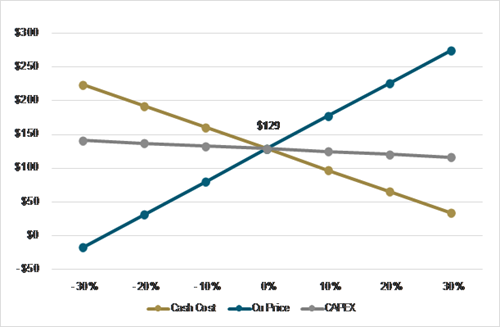
Figure 5. Sensitivity Analysis (Base Case Pre-Tax IRR)
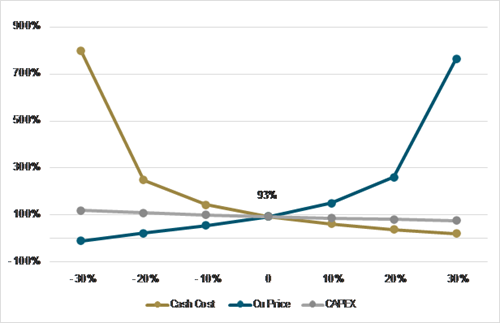
Figure 6. Sensitivity Analysis (PEA Mine Plan Pre-Tax IRR)
Mineral Reserves and Mineral Resources
Table 5. Mineral Resource Estimate
| Mining | Tcu Cut- | Tonnage | TCu | Copper | ||
| Resource Class | Method | Off (%) | (kt) | (%) | (klbs) | |
| Measured | ||||||
| Don Gabriel Manto | OP | 0.20% | 983 | 0.82% | 17,857 | |
| Don Gabriel Vetas | UG | 0.64% | 0 | 0.00% | 0 | |
| Papomono Massivo | UG | 0.34% | 2,449 | 1.94% | 104,796 | |
| Papomono Cumbre | OP | 0.19% | 266 | 0.49% | 2,844 | |
| Papomono Cumbre | UG | 0.34% | 0 | 0.00% | 0 | |
| Mantos Conexión | UG | 0.59% | 262 | 1.27% | 7,312 | |
| Papomono Sur | UG | 0.58% | 634 | 1.28% | 17,821 | |
| Epithermal | UG | 0.65% | 0 | 0.00% | 0 | |
| Papomono Norte | OP | 0.19% | 102 | 0.96% | 2,150 | |
| Manto Norte | UG | 0.58% | 834 | 1.08% | 19,894 | |
| Measured Mineral Resource | 5,530 | 1.42% | 172,674 | |||
| Indicated | ||||||
| Don Gabriel Manto | OP | 0.20% | 5,476 | 0.83% | 99,959 | |
| Don Gabriel Vetas | UG | 0.64% | 0 | 0.00% | 0 | |
| Papomono Massivo | UG | 0.34% | 891 | 1.62% | 31,881 | |
| Papomono Cumbre | OP | 0.19% | 2,388 | 0.54% | 28,429 | |
| Papomono Cumbre | UG | 0.34% | 351 | 0.48% | 3,699 | |
| Mantos Conexión | UG | 0.59% | 1,287 | 1.02% | 28,856 | |
| Papomono Sur | UG | 0.58% | 989 | 1.00% | 21,760 | |
| Epithermal | UG | 0.65% | 509 | 0.98% | 10,997 | |
| Papomono Norte | OP | 0.19% | 250 | 1.00% | 5,506 | |
| Manto Norte | UG | 0.58% | 633 | 0.97% | 13,495 | |
| Indicated Mineral Resource | 12,774 | 0.87% | 244,581 | |||
| Measured + Indicated | ||||||
| Don Gabriel Manto | OP | 0.20% | 6,459 | 0.83% | 117,816 | |
| Don Gabriel Vetas | UG | 0.64% | 0 | 0.00% | 0 | |
| Papomono Massivo | UG | 0.34% | 3,340 | 1.86% | 136,676 | |
| Papomono Cumbre | OP | 0.19% | 2,654 | 0.53% | 31,273 | |
| Papomono Cumbre | UG | 0.34% | 351 | 0.48% | 3,699 | |
| Mantos Conexión | UG | 0.59% | 1,549 | 1.06% | 36,168 | |
| Papomono Sur | UG | 0.58% | 1,623 | 1.11% | 39,581 | |
| Epithermal | UG | 0.65% | 509 | 0.98% | 10,997 | |
| Papomono Norte | OP | 0.19% | 352 | 0.99% | 7,656 | |
| Manto Norte | UG | 0.58% | 1,467 | 1.03% | 33,389 | |
| Measured + Indicated Mineral Resource | 18,304 | 1.03% | 417,255 | |||
| Inferred | ||||||
| Don Gabriel Manto | OP | 0.20% | 79 | 0.70% | 1,216 | |
| Don Gabriel Vetas | UG | 0.64% | 2,020 | 1.33% | 59,273 | |
| Papomono Massivo | UG | 0.34% | 22 | 2.64% | 1,282 | |
| Papomono Cumbre | OP | 0.19% | 537 | 0.66% | 7,861 | |
| Papomono Cumbre | UG | 0.34% | 298 | 0.53% | 3,482 | |
| Mantos Conexión | UG | 0.59% | 117 | 0.79% | 2,043 | |
| Papomono Sur | UG | 0.58% | 111 | 0.95% | 2,317 | |
| Epithermal | UG | 0.65% | 223 | 1.01% | 4,970 | |
| Papomono Norte | OP | 0.19% | 13 | 2.90% | 832 | |
| Manto Norte | UG | 0.58% | 37 | 1.39% | 1,131 | |
| Inferred Mineral Resource | 3,457 | 1.11% | 84,408 | |||
Notes to accompany Mineral Resources table:
- The Mineral resource estimate has an effective date of January 1, 2018 and is classified in accordance with the Canadian Institute of Mining, Metallurgy and Petroleum ("CIM") "CIM Definition Standards - For Mineral Resources and Mineral Reserves" adopted by the CIM Council (as amended) in accordance with the requirements of National Instrument 43-101 - Standards of Disclosure for Mineral Projects ("NI 43-101"). The Qualified Person is Michael G. Hester, Vice President, IMC, M.S. Mining Engineering.
- Mineral resources were estimated using a copper price of US$3.30/lb.
- OP means open pit mining, UG means underground mining method.
- Cutoff grades vary by deposit to reflect likely mining methods, variations in costs and slight variances in expected metal recovery by deposit.
- The Mineral Resources are in-situ estimates. IMC has not included any dilution or mining loss assumptions in the estimates.
- TCu is total copper assay, comprised of acid soluble (ACuS), cyanide soluble (CNCu) and residual copper (RCu), each with different metallurgical recoveries. Recoveries based on conversion from existing acid leach method to chloride media acid leaching as described in this announcement and Technical Report to be files within 45 days of this release.
- Average copper recovery is estimated at about 87% for the Don Gabriel Manto and Don Gabriel Vetas. The copper recovery for the various Papomono deposits range from 85% for the Epitermal to 90% for Papomono Masivo.
- It is assumed that Don Gabriel Manto, Papomono Norte and a portion of Papomono Cumbre will be mined by open pit methods by a mining contractor. Estimated contract mining costs are $2.35 and $2.15/t for mineralization and waste respectively. The plant feed haulage cost is estimated at $2.21/t for Don Gabriel and $1.76/t for Papomono and is based on a contractor quote.
- IMC does not believe that there are significant risks to the mineral resource estimates based on environmental, permitting, legal, title, taxation, socio-economic, marketing, or political factors other than discussed in the described Technical Report.
- Further information, including key assumptions, parameters and methods used to estimate mineral reserves and mineral resources will be described in the Technical Report to be published within 45 days of this announcement.
- Mineral resources are reported inclusive of mineral reserves. Mineral resources that are not mineral reserves do not have demonstrated economic viability. Mineral resources for proposed open pit deposits are constrained within an economic pit shell.
- Totals may not add due to rounding.
Table 6. Mineral Reserve Estimate from MTV Base Case Mine Plan
| Tonnage | Grade | Copper | ||
| Category | (kt) | (%Cu) | (kt Cu) | |
| Don Gabriel Manto | ||||
| Proven | 898 | 0.80% | 7.1 | |
| Probable | 4,270 | 0.82% | 34.9 | |
| Total Proven and Probable | 5,168 | 0.81% | 42.1 | |
| Papomono Masivo | ||||
| Proven | 2,559 | 1.51% | 38.7 | |
| Probable | 508 | 1.48% | 7.5 | |
| Total Proven and Probable | 3,067 | 1.51% | 46.2 | |
| Total Proven and Probable | 8,235 | 1.07% | 88.3 | |
Notes to accompany Mineral Reserves table:
- Mineral reserves are reported with an effective date of January 1, 2018 for Don Gabriel Manto and July 1, 2018 for Papomono Masivo.
- The qualified persons responsible for the mineral reserve estimate are Mr. Michael Hester, FAusIMM, an IMC employee for the Don Gabriel Manto Mineral Reserves and Mr. Alfonso Ovalle, RM CMC, a Wood employee, for the Papomono Masivo mineral reserves.
- For the open pit mining, all mineral reserves are contained within an optimized pit shell. Mining will use conventional open pit methods and equipment. Direct mining costs are estimated averaging US$2.15/t of material mined and $1.95/t per waste tonne. The overall slope angle was 50°. Minimal dilution and ore loss are incorporated into the block model. For mine planning and mineral reserve estimation a diluted model was constructed. Blocks with less than 30% manto solid contained in them were excluded as lost ore. Blocks with between 30% and 99.9% manto solid contained in them were diluted to full blocks with a dilution grade of 0.1% TCu.
- For the underground mining, all mineral resources within the cave outline have been converted to probable and proven mineral reserves. This includes low-grade indicated mineral resource and inferred mineral resource assigned zero grade that is treated as dilution. A footprint cut-off 0.40% TCu for the inclined block cave and 0.47% TCu for front caving was used define the footprint and column heights. An average dilution entry point of 40% of the column height was used. The NSR calculation assumed metal prices of US$2.75/lb Cu. Metallurgical assumptions in the NSR include recoveries of 89.37% for Cu. The recoveries correspond to the chloride leach process, currently implemented in the process plant.
- Processing costs for material sent to the heap leach are US$9.64/t for underground mining and US$9.73/t for open pit.
- G&A costs were assumed as US$0.20/lb Cu and the SX/EW costs were assumed as US$0.19/lb Cu.
- Tonnage and contained copper are reported in metric units and grades are reported as percentages.
- Rounding as required by reporting guidelines may result in apparent summation differences between tonnes, grade and contained metal.
Qualified Persons
The scientific and technical content contained in this news release has been reviewed, verified and approved by Dr Antonio Luraschi, RM CMC, Manager of Metallurgic Development and Senior Financial Analyst, Wood, Mr Sergio Navarrete, RM CMC, Mining Engineer, Wood, Mr Alfonso Ovalle, RM CMC, Mining Engineer, Wood, Mr Michael G. Hester, FAusIMM, Vice President and Principal Mining Engineer, Independent Mining Consultants, Inc., Mr Enrique Quiroga, RM CMC, Mining Engineer, Q&Q Ltda, Mr Gabriel Vera, RM CMC, Metallurgical Process Consultant, GVMetallurgy, and Mr Sergio Alvarado, RM CMC, Consultant Geologist, General Manager and Partner, Geoinvestment Sergio Alvarado Casas E.I.R.L. all of whom are independent qualified persons as defined by NI 43-101.
The Technical Report will be filed by SRHI on SEDAR within 45 days of this press release in accordance with the requirements of National Instrument 43-101.
Notes on Preliminary Economic Assessments
Please note that the PEA Case is preliminary in nature, that it includes inferred mineral resources that are considered too speculative geologically to have the economic considerations applied to them that would enable them to be categorized as mineral reserves, and there is no certainty that the PEA Case will be realized. Mineral resources that are not mineral reserves do not have demonstrated economic viability.
About MTV
MTV is a fully permitted operating mining complex located nine kilometers from Salamanca in Region IV of Chile. MTV comprises two main deposits: Papomono (underground) and Don Gabriel (open pit). The mine is currently operating and producing high grade copper cathode. The mine has significant infrastructure in place with a crushing and processing plant with nameplate capacity of 7,000 and 6,000 tonnes per day, respectively. The plant is designed to produce up to 18,500 tonnes per annum of copper cathodes. For more information about MTV, please visit http://www.mineratresvalles.com.
About Sprott Resource Holdings Inc.
SRHI acquires and grows a portfolio of cash-flowing businesses and businesses expected to cash flow in the natural resource sector. Based in Toronto, SRHI is part of the Sprott Group of Companies and seeks to deploy capital to provide our investors with exposure to attractive commodities. For more information about SRHI, please visit www.sprottresource.com.
Non-GAAP Financial Measures
"Cash costs" per recoverable pound is a non-GAAP financial performance measure. "Cash costs" per recoverable pound is based on cost of sales but excludes, among other items, the impact of depreciation. SRHI believes that the use of "cash costs" per recoverable pound will assist investors, analysts and other stakeholders in understanding the costs associated with producing copper, understanding the economics of copper mining, assessing the operating performance of MTV and also its ability to generate free cash flow from its operations. "Cash costs" per recoverable pound is intended to provide additional information only and does not have any standardized meaning under IFRS and other issuers may define it differently. This measure should not be considered in isolation or as a substitute for measures prepared in accordance with IFRS. Further details on non-GAAP measures are provided in the MD&A accompanying SRHI financial statements filed from time to time on SEDAR at www.sedar.com.
Cautionary Statement Regarding Forward-Looking Information
Certain statements in this news release, and in particular the "Next Steps" section, contain forward-looking information (collectively referred to herein as the "Forward-Looking Statements") within the meaning of applicable Canadian securities laws. The use of any of the words "expect", "anticipate", "continue", "estimate", "may", "will", "project", "should", "believe", "plans", "intends" and similar expressions are intended to identify Forward-Looking Statements. In particular, but without limiting the foregoing, this news release contains Forward-Looking Statements pertaining to: the economic and study parameters of MTV; mineral resource and mineral reserve estimates; the cost and timing of development of MTV; the proposed mine plan and mining methods; dilution and extraction recoveries; processing method and rates and production rates; projected metallurgical recovery rates; additional infrastructure requirements or infrastructure modifications; capital, operating and sustaining cost estimates; the projected life of mine and other expected attributes of MTV; the NPV and IRR and payback period of capital; availability of capital; future metal prices; changes to MTV’s configuration that may be requested as a result of stakeholder or government input; government regulations and permitting timelines; estimates of reclamation obligations; requirements for additional capital; environmental risks; and general business and economic conditions.
Although SRHI believes that the Forward-Looking Statements are reasonable, they are not guarantees of future results, performance or achievements. A number of factors or assumptions have been used to develop the Forward-Looking Statements, including: there being no significant disruptions affecting the development and operation of the Project; the availability of certain consumables and services and the prices for power and other key supplies being approximately consistent with assumptions in the Technical Studies; labour and materials costs being approximately consistent with assumptions in the Technical Studies; fixed operating costs being approximately consistent with assumptions in the Technical Studies; permitting and arrangements with stakeholders being consistent with current expectations as outlined in the Technical Studies; certain tax rates, including the allocation of certain tax attributes, being applicable to the Project; the availability of financing for MTV’s planned development activities; assumptions made in mineral resource and mineral reserve estimates and the financial analysis based on the mineral reserve estimate and in the case of the PEA, the mineral resource estimate, including (as applicable), but not limited to, geological interpretation, grades, commodity price assumptions, extraction and mining recovery rates, hydrological and hydrogeological assumptions, capital and operating cost estimates, and general marketing, political, business and economic conditions. Actual results, performance or achievements could vary materially from those expressed or implied by the Forward-Looking Statements should assumptions underlying the Forward-Looking Statements prove incorrect or should one or more risks or other factors materialize, including: (i) possible variations in grade or recovery rates; (ii) copper price fluctuations and uncertainties; (iii) delays in obtaining governmental approvals or financing; (iv) risks associated with the mining industry in general (e.g., operational risks in development, exploration and production; delays or changes in plans with respect to exploration or development projects or capital expenditures; the uncertainty of estimates and projections relating to mineral reserves, production, costs and expenses; and labour, health, safety and environmental risks); (v) performance of the counterparty to the ENAMI Tolling Contract; (vi) risks associated with investments in emerging markets; and (vii) those risks disclosed in the Corporation’s filings with Canadian securities regulators on SEDAR at www.sedar.com. See also the cautionary language under “Notes on Preliminary Economic Assessments” above. The Forward-Looking Statements speak only as of the date hereof, unless otherwise specifically noted, and SRHI does not assume any obligation to publicly update any Forward-Looking Statements, whether as a result of new information, future events or otherwise, except as may be expressly required by applicable Canadian securities laws.
Cautionary Note to United States Investors Concerning Estimates of measured, indicated and inferred mineral resources
This news release may use the terms "measured", "indicated" and "inferred" mineral resources. United States investors are advised that while such terms are recognized and required by Canadian regulations, the United States Securities and Exchange Commission does not recognize them. "Inferred mineral resources" have a great amount of uncertainty as to their existence, and as to their economic and legal feasibility. It cannot be assumed that all or any part of an inferred mineral resource will ever be upgraded to a higher category. Under Canadian rules, estimates of inferred mineral resources may not form the basis of feasibility or other economic studies. United States investors are cautioned not to assume that all or any part of measured or indicated mineral resources will ever be converted into mineral reserves. United States investors are also cautioned not to assume that all or any part of an inferred mineral resource exists or is economically or legally mineable.
For further information:
Glen Williams
Managing Director, Investor Relations
T: (416) 943-4394
E: gwilliams@sprott.com
1 Based on preliminary economic analysis (PEA) case study results. See “Notes on Preliminary Economic Assessments”.
2 See “Notes on Preliminary Economic Assessments”.
3 See “Notes on Preliminary Economic Assessments”.


